
Correlation VS Causation
In economics, variables show various patterns and relationships which can be analyzed through statistics and econometrics. The variables are measured, organized, analyzed, and are presented to show different fashion. When it comes to studying the relationships between variables, some of them are confused with one another. Correlation and causation vary by a long shot in decision-making.
 What is Correlation?
Correlation, a term in statistics, explains the relationship between two variables and their degree of association. The fact of two variables being so correlated that any change in one accompanies parallel change in other. Correlation may be linear, when all points (X,Y) on a scatter diagram seem to cluster near a straight line, or nonlinear, when all points seem to lie near a curve. The relationship between the variables may be positive, negative or there may no relationship at all. It, being a measurable term, has a degree of covariability ‘r’ which varies from -1 to +1.
In correlation analysis variables are symmetrically treated, that there is no distinction between the dependent and the explanatory variables; both assumed to be random.
What is Causation?
Although correlation analysis deals with the degree of relationship between two variables, it does not necessarily imply causation. In the words of Kendall and Stuart, “A statistical relationship, however strong and however suggestive, can never establish causal connection”. Our ideas of causation must come from outside statistics, ultimately from some theory, that a statistical relationship in itself cannot logically imply causation. To ascribe causality, one must appeal to a priori or theoretical considerations.
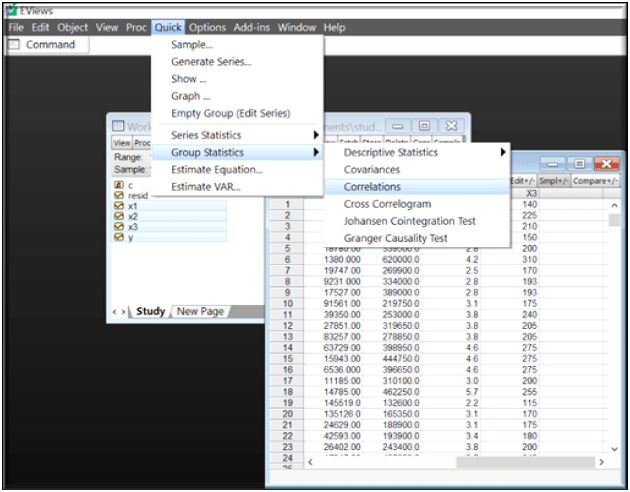
Correlation with EViews: EViews, A solution to get statistical and econometric analysis done through just a set of clicks, shows both relationships through a set of data. Moving swiftly, let’s look at the data. Here, the sample data has a dependent variable ’y’ resulting values from explanatory variables: x1, x2 and x3. EViews is smart enough to interpret the stochastic values and the intercept on its own, displaying all the variables individually as objects.
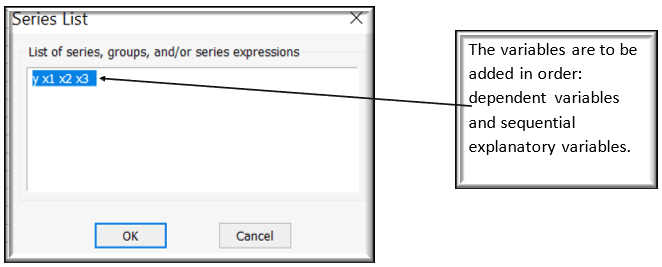
Clicking on Quick/Group statistics/ Correlations gives you a pop up to enter list of series of which the correlation analysis is being performed.
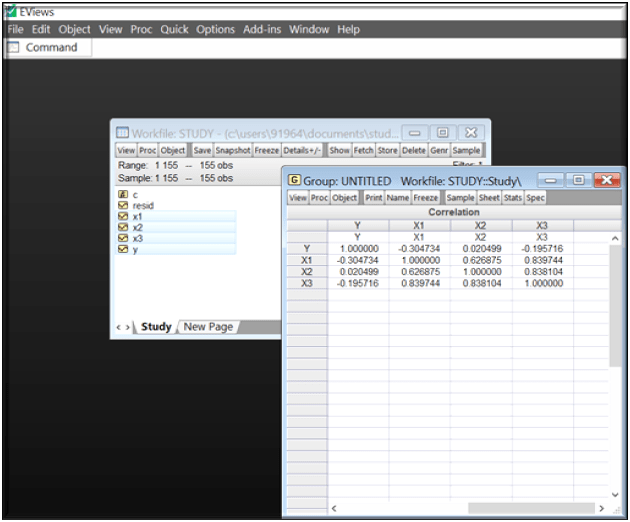
Clicking OK gives the correlation results presenting symmetrical relationship between all the variables with one another. The results can be interpreted through the rows and column’s, instanteously Y being negatively correlated with x1 and x3 and positively correlated with x2. The correlation among the explanatory variables can be seen through the spreadsheet itself.
Correlation With EViews
Causation with EViews- Subsequently, we jump to finding out the direction of influence between variables; i.e. causation explained by Granger, as to conclude that: Is it the one variable causing the other or vice versa. Finding direction of influence again involves a set of clicks, Select the required variables/Quick/Group Statistics/Granger Causality Test. Let’s have a look-
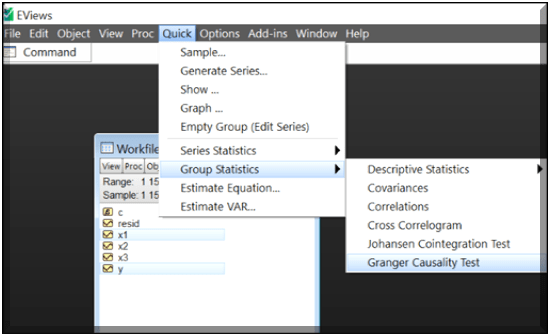
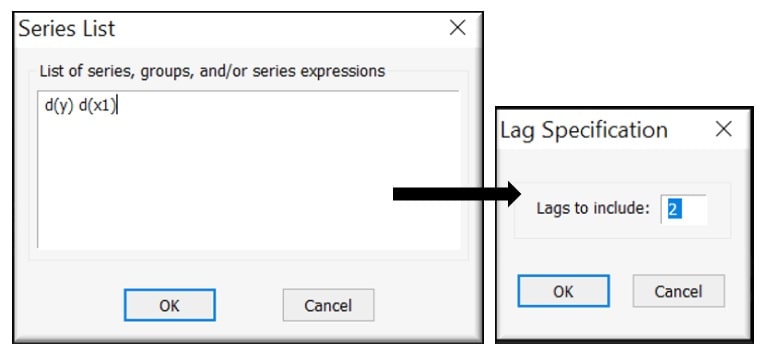
Selecting the above options, pops up with a series list to enter list of series(as the name suggests) and then the no. of lags required as per the analysis. Here, First difference is taken in order to make the series stationary.
EViews effortlessly brings up the results on the window, where we see that the causality with lags ‘2’ is generated.
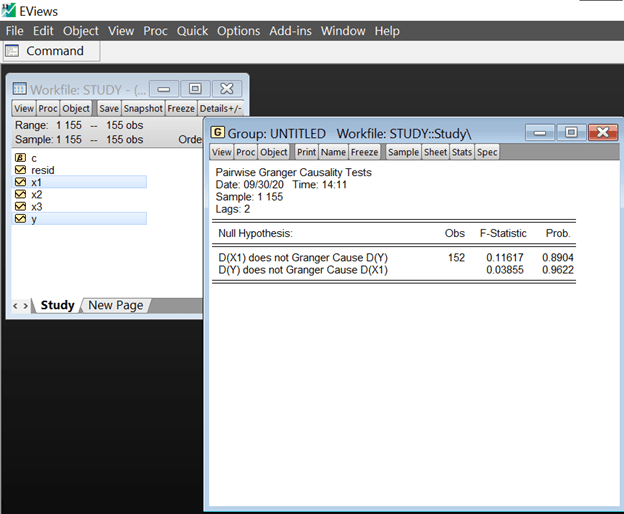
Interpreting, the F-statistic being high and Probability comparatively low in the case of first Null hypothesis, implying rejection of the hypothesis in comparison to the second. Conclusively, saying that X1 causes Y or X1 → Y, where the arrow denotes causation.
References:-
- Koutsoyiannis, A. “Correlation Theory.” Theory of Econometrics, Second ed., PALGRAVE, 2004, pp. 31–43.
- Gujrati, Damodar N. “Causality in Economics.” Basic Econometrics, edited by Dawn C Porter, Fifth ed., The McGraw Hill, 2009, pp. 653–654.


 Copyright © 2020 | ® Numerical Analytics Instruments Pvt. Ltd | All Rights Reserved.