

What’s New in EViews 12?
EViews 12 features a wide range of exciting changes and improvements. What follows is a list of a few of the most important new features. This is not a complete list of the new features in EViews 12 but focuses on many important ones. Let’s get started.
New EViews Interface
New Workfile Format:
EViews 12 now supports a new workfile file format (“.WF2”). This new format is text-based (using JSON) which means it can be opened using any simple text editor to view all workfile data elements.
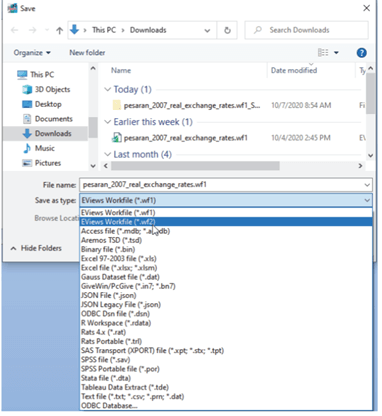
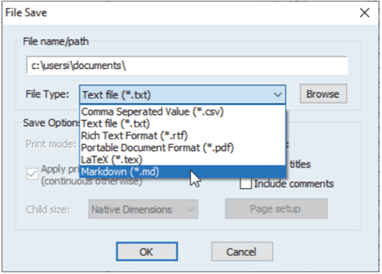
Table Export to Markdown Format:
EViews 12 has extended the printing capabilities of EViews with Markdown. Tables, graphs, and other output objects can now be formatted with the basic features of this simple, easy-to-read markup language.
Graphs
Animated graphs
Static graphs display data for a fixed range of observations. That range may consist of a single observations or multiple observations, but it does not change. With animated graphs, you can dynamically adjust the range of data and thusly display how the data change over a given interval. Animated graphs allow viewers to see how data transition from period to another or alternatively compare the data between periods.
XY Error Bar graphs
The XY error bar graph is an observation graph of a group containing a multiple of four series. The first series contains the x-axis points, the second series is the upper error bar, the third series is the lower error bar, and the fourth series is the data series plotted as a symbol. They are designed for displaying data with standard error bands against a non-observation-based series. You may display an XY error bar graph for any group object containing four or more series
Date-based line and shade placement
EViews 12 adds the ability to specify placement of these elements using sample statements. This feature makes it easy to place objects at irregular elements in dated workfiles, when for example, using if conditions to highlight observations meeting a condition, say high unemployment. Similarly, you may now use predefined sample objects to place shade elements, and commonly employed intervals, when for example shading periods of recession.
Econometrics and Statistics
Estimation and Analysis
- Regression Variable Selection using GETS and Lasso
- Indicator saturation testing for outliers and structural breaks in a regression specification
The indicator saturation approach is an extension of least squares regression for testing for outliers and structural breaks in a regression specification. The indicator saturation approach works by including indicator variables for outliers or structural breaks at every observation in the regression, and then employing the GETS algorithms to select which of the included variables should be retained in a final regression model. - Improved MIDAS Mixed Frequency Regression
EViews 12 extends the existing MIDAS toolbox by adding additional estimation options. These new features allow you to use the General-to-Specific (GETS) method for variable selection and indicator saturation - Fractionally Integrated GARCH and EGARCH estimation and new evaluation tools for all GARCH models
EViews 12 introduces several new tools for estimating and working with conditional variance models. These tools include new estimation methods that allow for long-memory processes, and new equation views that make it easy to examine the properties of your GARCH estimated equations - Enhanced Elastic Net and LASSO tools
EViews 11 includes tools for estimation of elastic net, ridge, and LASSO regression models. EViews supports estimation over a single lambda penalization parameter and a grid search over multiple penalization parameters. When multiple parameters are used, EViews also supports options for automatic generation of penalization parameters, as well as cross-validation tools for choosing the parameter with the lowest error. - Improved VAR impulse response user interface
The prior impulse response interface coupled the choices for which impulses and responses to display and the method in which they were displayed, with the various options for computing the impulse response and standard error. Thus, if a user first displayed a multiple graph of impulse responses and then wanted to show the results in a table, or perhaps display a subset of those original responses, the procedure would have to be respecified and recomputed from the beginning. - Bootstrap impulse response confidence intervals for VARs and Two-way cluster robust standard errors in panel and pool settings
These new tools allow you to compute residual bootstrap, residual double bootstrap, and fast residual double bootstrap estimates of these confidence intervals. EViews supports a variety of confidence interval bootstrap methods, including standard percentile, Hall’s (1992) percentile confidence intervals, Hall’s (1986) studentized confidence interval, and Killian’s (1998) unbiased confidence interval.
Testing and Diagnostics
- Correlated (second generation) panel unit root tests (PANIC and CIPS)
- Wavelet decomposition of a series: discrete transform, outlier detection, decomposition of variance, thresholding
Wavelet decomposition can decompose a series into its long-run behavior (smooths) and short run behavior (details). Among other things, wavelets may be used to obtain a long-run approximation to a series by neglecting transient features (thresholding), detect outliers & decompose a series variance - New number of factor selection methods for principal components and factor analysis
EViews 12 adds the Bain and Ng (200) and Ahn and Horenstein (2013) methods for determining the number of factors to retain to our existing principal components and factor analysis engines.
Data Handling
- DBnomics support
DBnomics provides access to a large range of publicly available economic data from national and international institutions like the IMF, Eurostat, World Bank, ECB, etc. - U.S. Energy Information Administration support
The EIA database is a large collection of free and publicly available energy and related economic data provided by the U.S. Energy Information Administration. EViews Enterprise Edition supports both online access to EIA data via the EIA web server and offline access to data downloaded in the EIA Bulk File format - IHSMarkit support
- OECD SDMX support
EViews offers a custom interface to the SDMX databases. The interface includes a custom browser for navigating and retrieval of available data.
Models
- Solving control to meet target
Normally, when solving a model, we start with a set of known values for our exogenous variables, then solve for the unknown values of the endogenous variables of the model. If we would like an endogenous variable in our model to follow a particular path, we can solve the model repeatedly for different values of the exogenous variables, changing the values until the path we want for the endogenous variable is produced. For example, in a macroeconomic model, we may be interested in examining what value of the personal tax rate would be needed in each period to produce a balanced budget over the forecast horizon. - Endogenous variables specification
The alternative to a numerical search for exogenous values is to respecify the model such that the exogenous control variables are made endogenous and the endogenous target series are made exogenous. The values of the control series can then be computed using the standard model solve procedure (with the trajectory series overriding the target series).
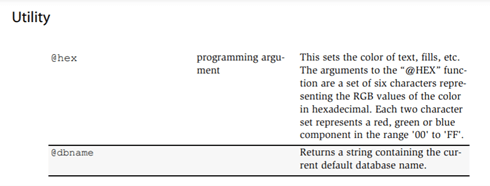
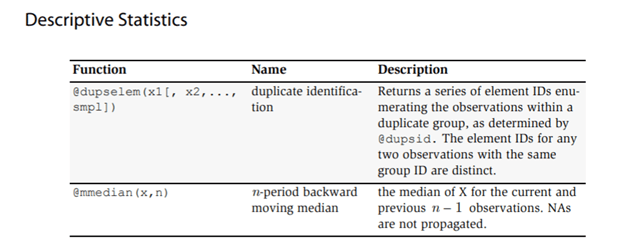
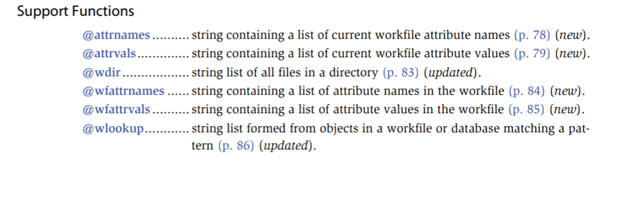
Preliminary Updates to Function Reference
- Preliminary list of new and updated functions


 Copyright © 2020 | ® Numerical Analytics Instruments Pvt. Ltd | All Rights Reserved.