

Descriptive Statistics and Eviews

EViews has a lot to offer when it comes to data analysis, which includes descriptive statistics, impressive graphs, tests, and procedures as it understands the importance of statistical analysis s an important task to examine series and groups.
The fact that EViews is the most easy-to-use Statistical software, it understands all our needs to view different displays of our series, provides general statistics and statistics for time series, modify a series labels all with a just a set of clicks.
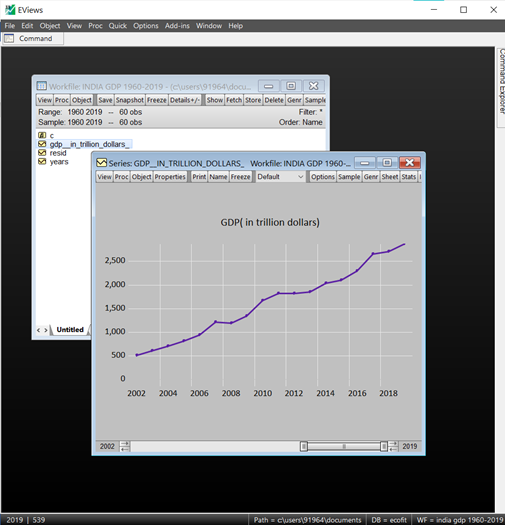
Taking an example, we have used GDP data of India from 1960 to 2019 measured in trillion dollars. The magical menus in Eviews for any series is the View and the Proc menu. The main data analysis can be done once you click on the View menu where all actions are divided into four blocks.
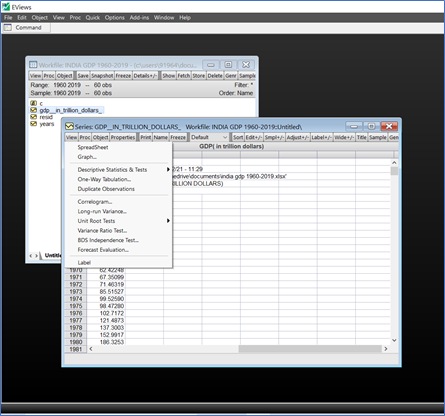
The first section views the data series in spreadsheet and Graph which is fully customizable in the Options tab.
The second section provides descriptive statistics and tests as well as one way tabulation of your series.
Descriptive statistics and tests-
This section of the View menu has various options allowing to get a deep statistical analysis of the data.
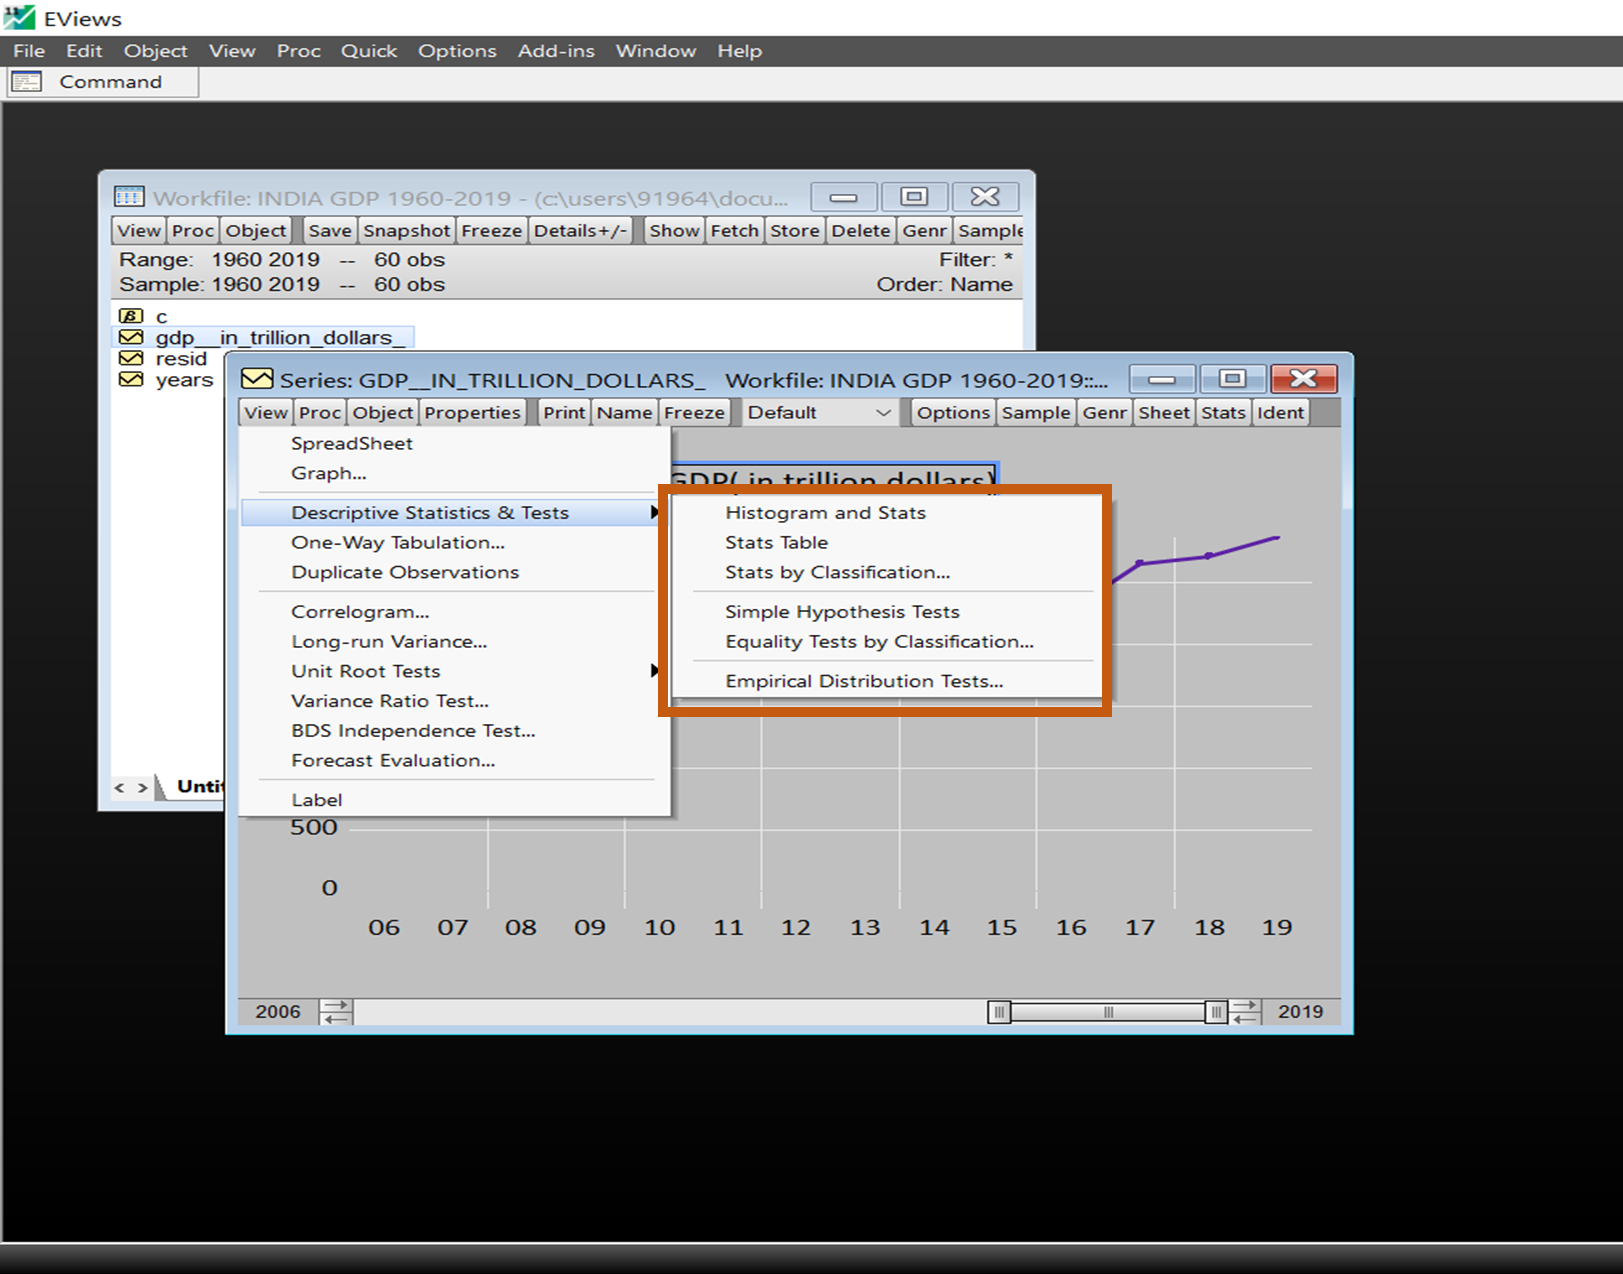
For Histogram & Stats Table –
Simply clicking on View/ Descriptive statistics and tests/ Histogram and stats
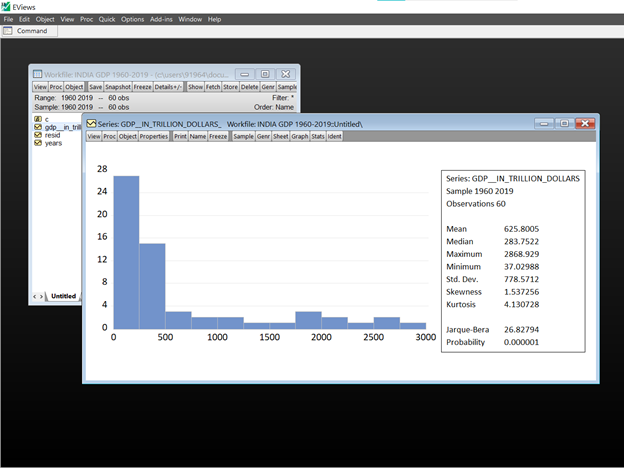
The results show the name of the series, the sample and the number of observations at top of the statistics panel. EViews summarizes the main statistics for the series measuring central tendencies, Maximum and minimum values, standard deviation, skewness- the measure of asymmetry in data, kurtosis- The presence of fat tails, the Jarque-bera statistic and its associated p-value.
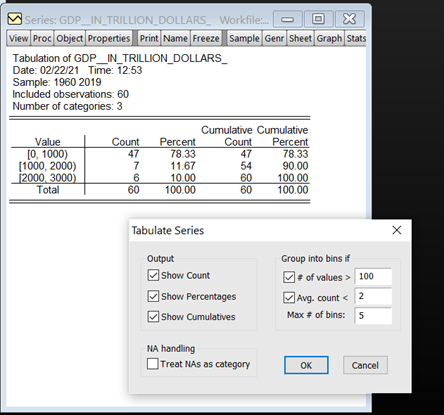
For Tabulation Analysis – View/ Descriptive statistics and tests/ One way Tabulation.
In this View EViews provides the counts, percentage counts and cumulative counts for each observation value.
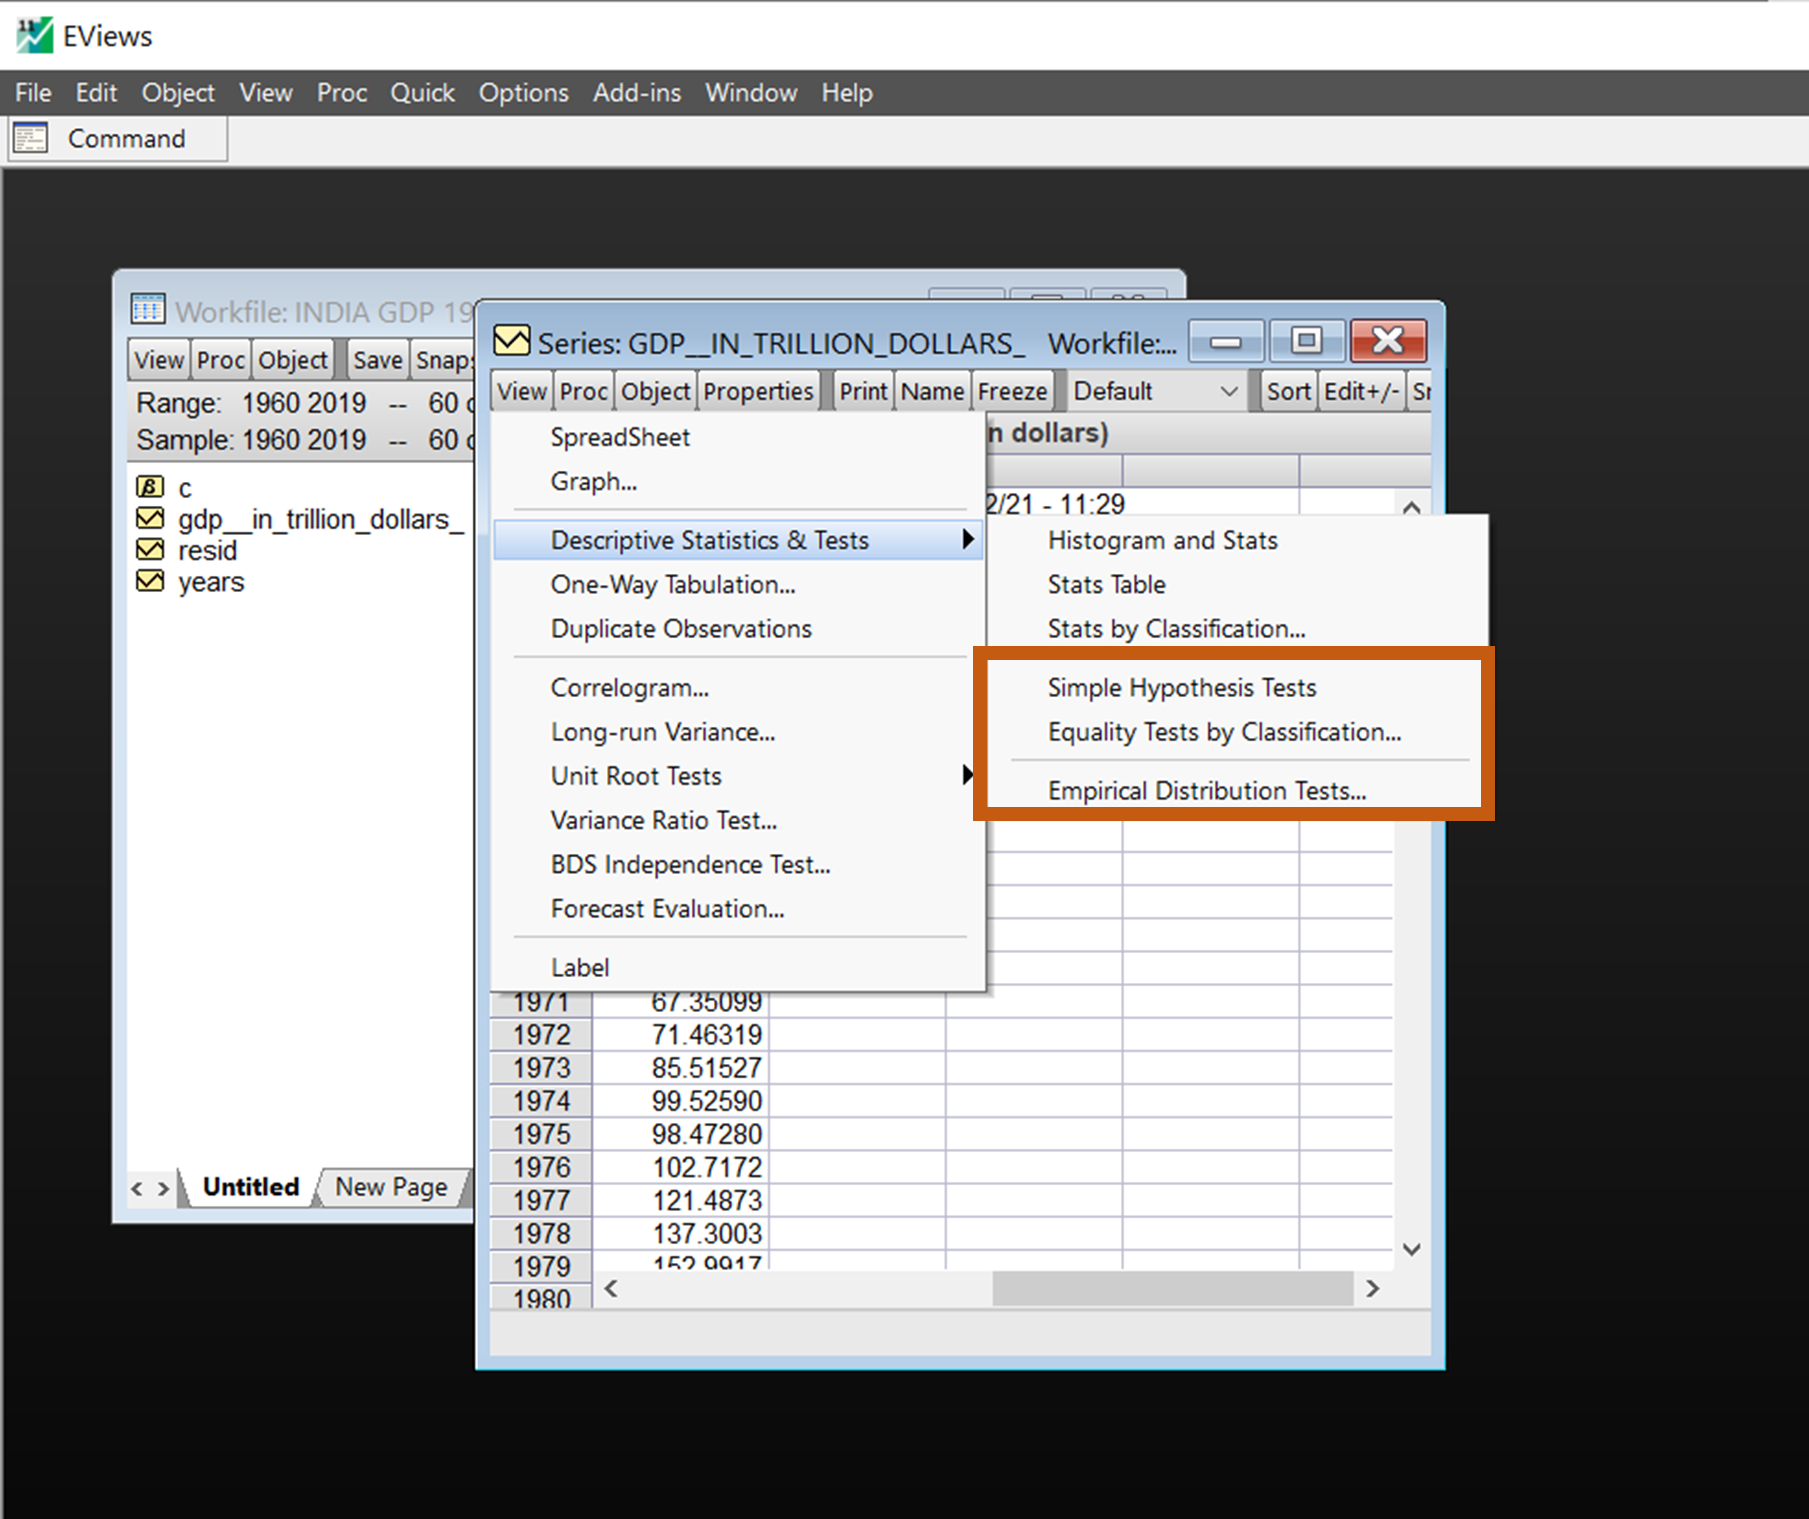
Apart from descriptive statistics, EViews allows to carry out a number of formal hypothesis tests on a series namely
- Simple hypothesis tests – Tests for Mean, median and variance of the series.
- Equality Tests by Classification– Tests equality of means, medians and variance across subsamples of a series.
- Empirical Distribution Tests– Tests whether the data distribution of the series is drawn from a number of well-known distributions.
Simple hypothesis tests
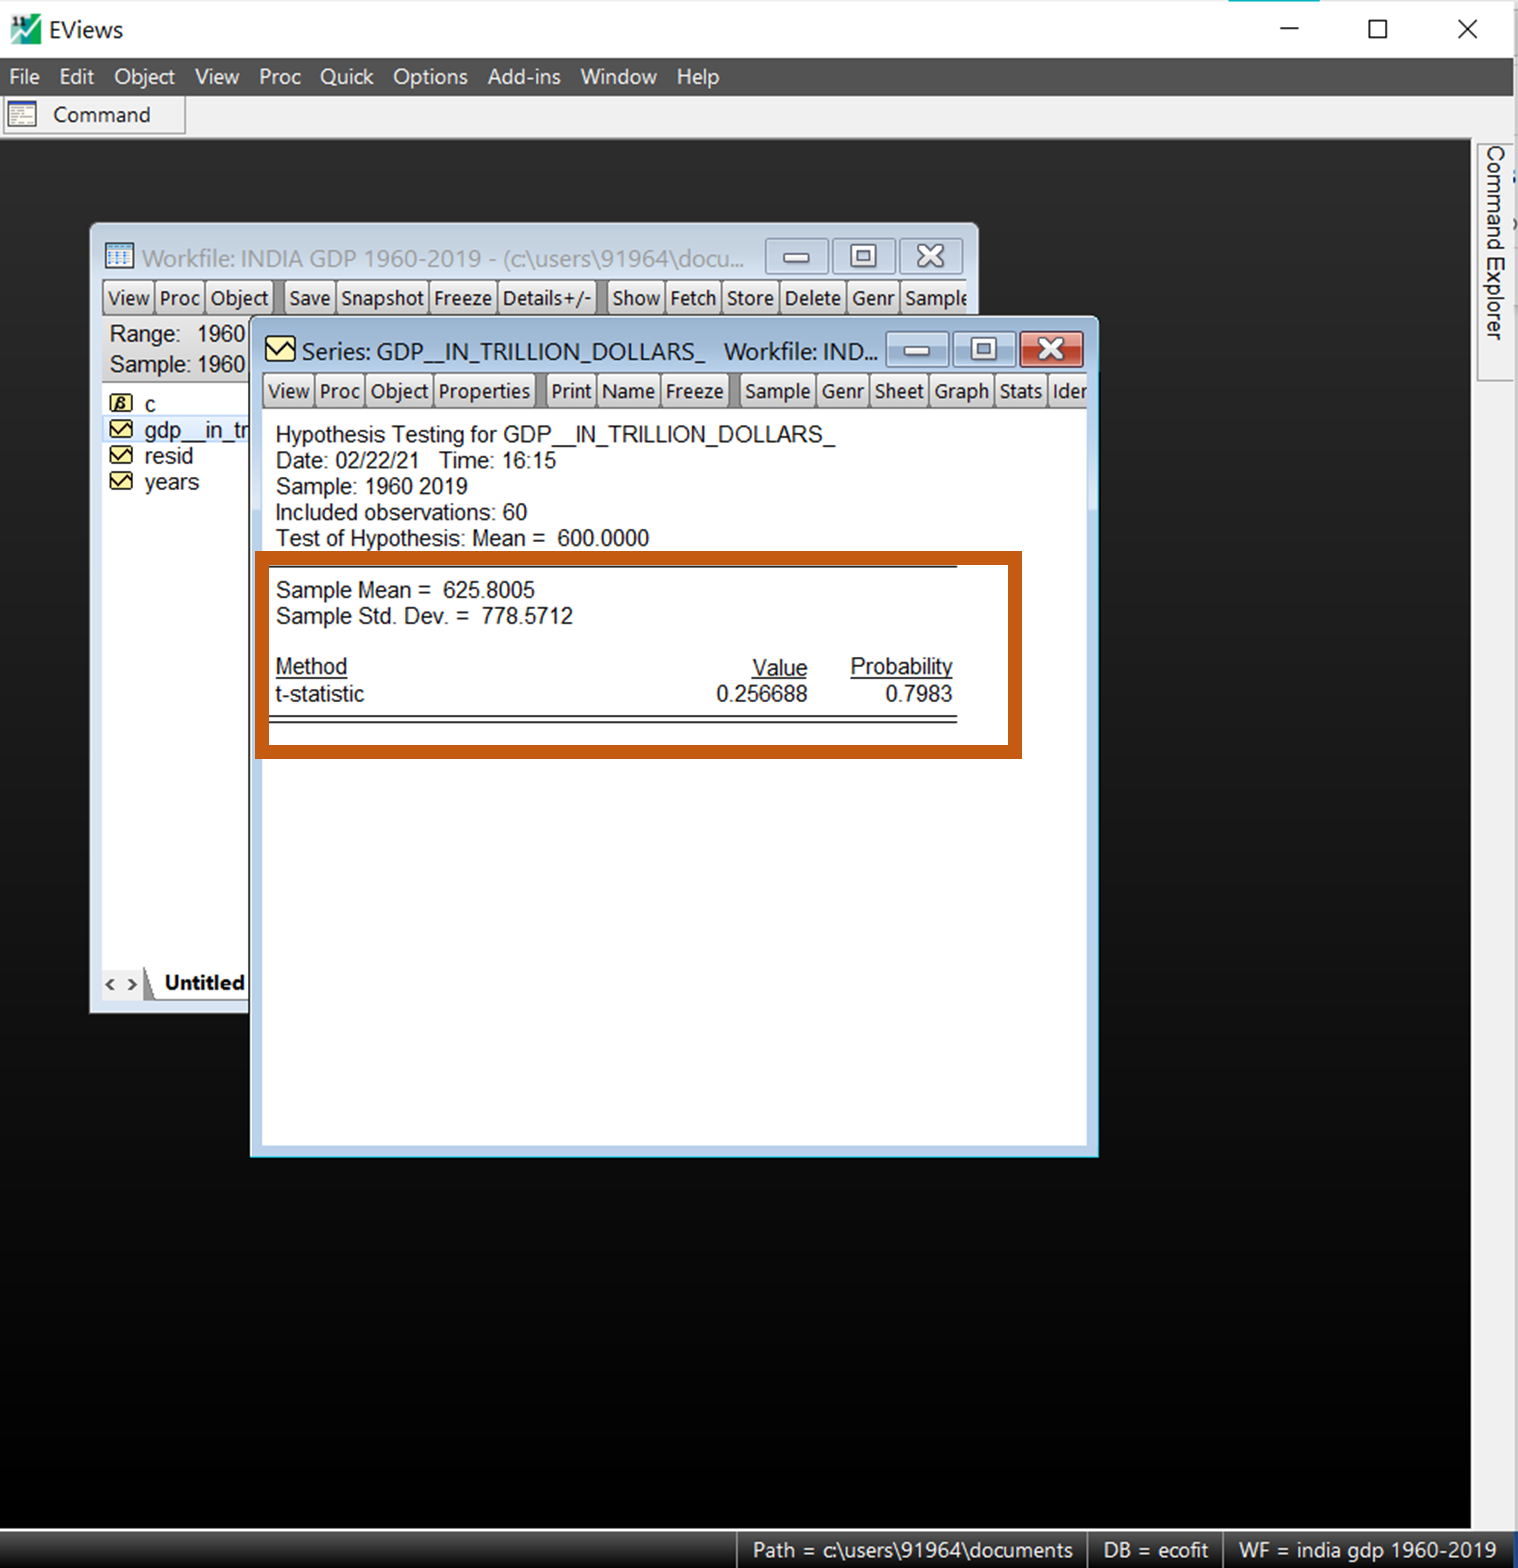
One of the most common tests of series is to compare whether its mean is equal to a specific value. The GDP in our example can be tested for a mean of 600 trillion dollars if it is statistically significant.
- Open GDP series
- Click View/Descriptive statistics and tests/Simple Hypothesis Tests
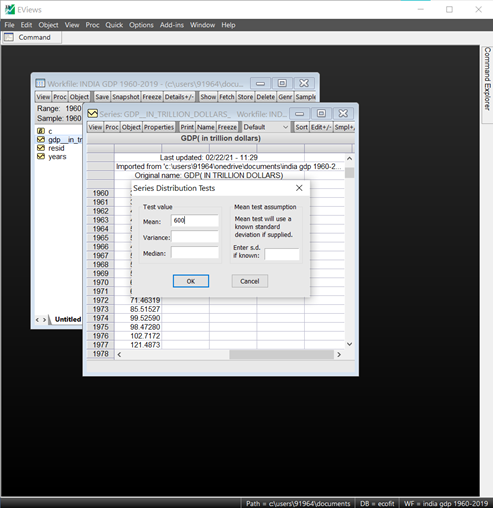
- In the Series Distribution Tests dialog box, the test values can be added for Mean, Variance, and median.
- For Instance, we test the mean of ‘600 trillion dollars’ for the whole observations.
The results of the same appear and clearly the p-value is significant, and the null-hypothesis cannot be rejected.
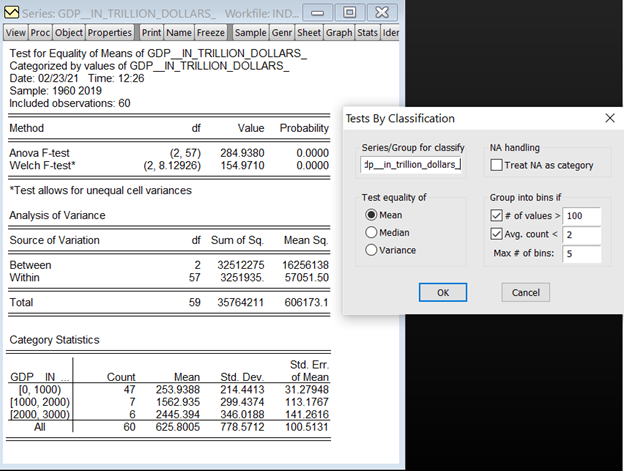
Equality Tests by Classification
This view allows you to test equality of the means, medians and variances across sub samples of a single series.
For example, you can test whether mean income is the same for males and females, or whether the variance of education is related to race. The tests assume that the subsamples are independent.
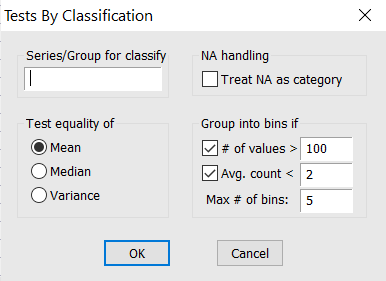
Letting EViews know which series is to be classified
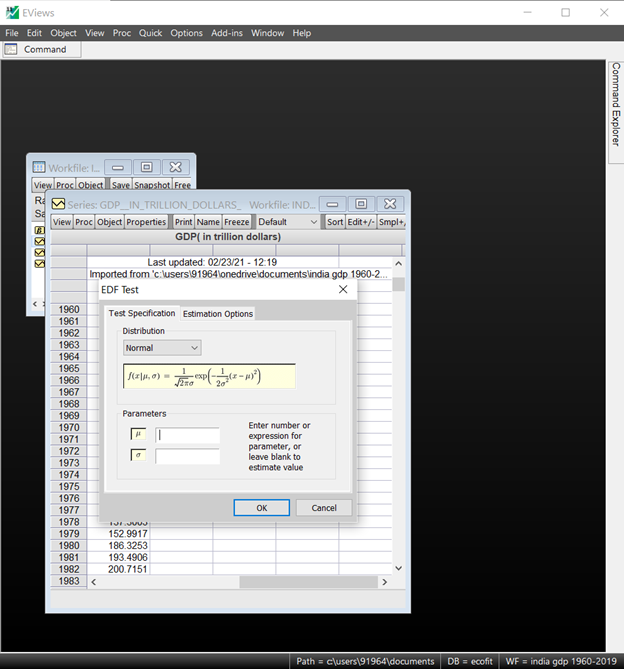
Empirical Distribution Tests
EViews provides built-in Kolmogorov-Smirnov, Lilliefors, Cramer-von Mises, Anderson-Darling, and Watson empirical distribution tests. These tests are based on the comparison between the empirical distribution and the specified theoretical distribution function.
You can test whether your series is normally distributed, or whether it comes from, among others, an exponential, extreme value, logistic, chi-square, Weibull, or gamma distribution. You may provide parameters for the distribution, or EViews will estimate the parameters for you.
To carry out the test, simply double click on the series and select View/Descriptive Statistics & Tests/Empirical Distribution Tests… from the series window.
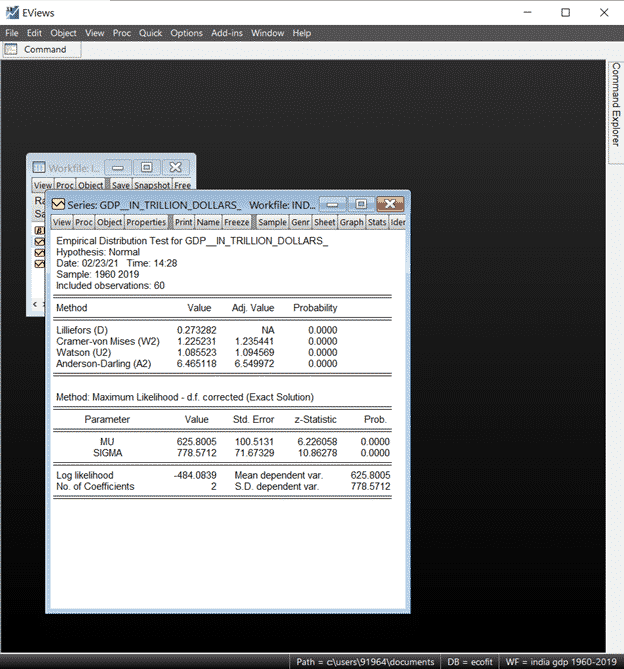
The output of the test is shown in the screenshot and both the mean and variance is estimated. The value reports the asymptotic test statistics while the second column, “Adj. Value”, reports test statistics that have a finite sample correction or adjusted for parameter uncertainty (in case the parameters are estimated). The third column reports p-value for the adjusted statistics.
All of the reported EViews p-values will account for the fact that parameters in the distribution have been estimated.
The second part of the output table displays the parameter values used to compute the theoretical distribution function. Any parameters that are specified to estimate are estimated by maximum likelihood (for the normal distribution, the ML estimate of the standard deviation is subsequently degree of freedom corrected if the mean is not specified a priori). For parameters that do not have a closed form analytic solution, the likelihood function is maximized using analytic first and second derivatives. These estimated parameters are reported with a standard error and p-value based on the asymptotic normal distribution.


 Copyright © 2020 | ® Numerical Analytics Instruments Pvt. Ltd | All Rights Reserved.